
The Only 3 Google Analytics Metrics You Need to Track
by Editor

The Only 3 Google Analytics Metrics You Need to Track
Google Analytics is an indispensable tool for anyone with an online presence. It offers a seemingly infinite array of data points, slicing and dicing visitor behavior in countless ways. While this depth is incredibly powerful, it can also be overwhelming, leading to analysis paralysis.
Many website owners and marketers find themselves drowning in dashboards, obsessing over dozens of metrics, and ultimately struggling to identify what truly matters for their business goals.
The truth is, you don’t need to track everything Google Analytics offers to understand your website’s performance and make informed decisions. In fact, focusing on a core set of critical metrics can provide a much clearer picture of your success and highlight the most impactful areas for improvement.
While every website and business has unique objectives, there are three fundamental Google Analytics metrics that, when understood and tracked diligently, can provide a comprehensive overview of your site’s health, user engagement, and business effectiveness.
These three metrics represent different crucial stages of the user journey and cut through the noise to reveal whether your website is achieving its purpose.
Forget the dozens of reports and hundreds of dimensions. Master these three, understand their nuances, and learn how to influence them, and you will possess the essential insights needed to drive meaningful growth.
So, what are these indispensable three? They are:
- Bounce Rate: Your initial engagement health check.
- Average Session Duration: A key indicator of content value and user interest.
- Conversion Rate: The ultimate measure of your website’s business effectiveness.
Let’s dive deep into each of these, exploring what they are, why they matter, how to track them effectively, what influences them, and most importantly, how to use the insights they provide to improve your website’s performance.
Metric 1: Bounce Rate – The First Impression Indicator
What is Bounce Rate?
In Google Analytics (specifically Universal Analytics), a bounce is defined as a single-page session on your site.
This means the user arrived on a page and then left without interacting with anything else on that page that would trigger another hit to Google Analytics, such as clicking a link to another page, triggering an event (like playing a video or submitting a form if configured as an event), or completing a transaction.
Bounce Rate is calculated as the percentage of all sessions that were single-page sessions (bounces).

Note on GA4: Google Analytics 4 introduces the concept of “Engaged Sessions” and “Engagement Rate.” While GA4 still shows a Bounce Rate metric, its calculation is the inverse of Engagement Rate. An engaged session in GA4 is a session that lasts longer than 10 seconds, or has a conversion event, or has 2 or more page/screen views.
Bounce Rate in GA4 is the percentage of sessions that are not engaged sessions. This makes GA4’s Bounce Rate a slightly different, and arguably more nuanced, metric than UA’s traditional Bounce Rate, as it considers time and events, not just a single page view.
However, the principle of understanding immediate disengagement remains relevant, and tracking the rate of non-engaged sessions (or conversely, engagement rate) is still critical.
For the purpose of this core three, we’ll largely discuss the concept of a quick exit, which Bounce Rate (in either version, with awareness of the nuance) helps identify.
Why is Bounce Rate Crucial?
Bounce Rate is your website’s first impression metric. A high bounce rate on a landing page suggests that visitors are arriving and quickly deciding the page isn’t what they expected, isn’t relevant to their needs, or is simply unappealing or difficult to use.
Tracking Bounce Rate helps you understand:
- Landing Page Effectiveness: Is the content on your entry pages relevant to the traffic sources driving visitors there?
- Traffic Quality: Are you attracting the right kind of audience? Traffic from irrelevant sources will likely have high bounce rates.
- User Experience Issues: Slow loading times, poor design, confusing navigation, or mobile usability problems can all lead to immediate exits.
- Content Relevance: For pages designed to keep users engaged (like blog posts or product pages), a high bounce rate might indicate the content isn’t meeting visitor expectations.
What Does a High or Low Bounce Rate Mean? (It’s Not Always Simple!)
Conventionally, a low bounce rate is seen as good, and a high bounce rate is seen as bad. However, this is an oversimplification. The interpretation of Bounce Rate is heavily dependent on:
- Page Type: A blog post designed to provide a quick answer might naturally have a higher bounce rate than a complex product page that encourages exploration. If a user finds the information they needed on that single page and leaves, that might be a successful visit from their perspective, even if it’s a bounce.
- User Intent: A user searching for a specific phone number might land on your contact page, find the number, and leave. This is a bounce but fulfills their goal.
- Traffic Source: Traffic from paid ads targeting a very specific long-tail keyword might have a lower bounce rate than general organic traffic arriving on a broad homepage. Social media traffic often has higher bounce rates as users are Browse, not actively searching for something specific.
Therefore, instead of aiming for an arbitrary “good” Bounce Rate number (like under 50%), focus on:
- Tracking trends: Is your Bounce Rate going up or down over time?
- Segmenting your data: Analyze Bounce Rate by landing page, traffic source, device, audience, etc. This helps pinpoint where the problem areas are. A high overall Bounce Rate might be skewed by one or two underperforming landing pages or traffic sources.
Factors Influencing Bounce Rate:
Numerous factors can cause visitors to leave your site quickly:
- Slow Page Load Speed: In today’s fast-paced digital world, users expect pages to load instantly. Delays are a major bounce trigger.
- Irrelevant Content: If your landing page doesn’t match the user’s expectations based on the link they clicked (e.g., an ad, a search result), they will leave.
- Poor Design and User Experience (UX): Cluttered layouts, confusing navigation, overwhelming pop-ups, or difficult-to-read text can frustrate visitors.
- Lack of Mobile Responsiveness: If your site doesn’t display and function well on mobile devices, a significant portion of your traffic might bounce.
- Lack of Clear Call to Action (CTA): If the user doesn’t know what to do next, they might leave.
- Technical Errors: Broken links, non-functioning forms, or display issues.
- Mismatch in User Intent: The page doesn’t fulfill the specific need the user had when they arrived.
- Misleading Advertising or Links: If your marketing promises something your landing page doesn’t deliver.
How to Track and Segment Bounce Rate:
- In Universal Analytics: You’ll find Bounce Rate in almost every report (Audience, Acquisition, Behavior). Look at it for your overall site, but critically, examine it in:
- Landing Pages Report: (Behavior > Site Content > Landing Pages) – This shows the bounce rate for the first page a user saw. This is arguably the most important place to analyze Bounce Rate.
- Channels Report: (Acquisition > All Traffic > Channels) – Compare Bounce Rate across different marketing channels (Organic Search, Direct, Social, Email, Paid Search, etc.).
- Source/Medium Report: (Acquisition > All Traffic > Source/Medium) – More granular than Channels, e.g., ‘google/organic’, ‘facebook/referral’, ‘newsletter/email’.
- Devices Report: (Audience > Mobile > Overview) – Compare desktop, mobile, and tablet Bounce Rates.
- In Google Analytics 4: Find Bounce Rate in standard reports or build explorations. Remember it’s the inverse of Engagement Rate. Focus on the Engagement Rate metric as well, which is often a more positive indicator of session quality. Look at it in reports like ‘Pages and screens’ or in custom reports focusing on traffic acquisition.
How to Improve Bounce Rate:
Improving Bounce Rate requires identifying the underlying cause through segmentation and analysis. Potential strategies include:
- Improve Page Load Speed: Optimize images, leverage browser caching, minify CSS/JavaScript, use a Content Delivery Network (CDN).
- Enhance Content Relevance and Quality: Ensure your landing page content directly addresses the user’s needs based on how they arrived. Use clear headlines, compelling copy, and relevant information.
- Optimize User Experience (UX): Simplify navigation, use clear headings and subheadings, break up text with visuals, ensure readability, and fix any technical glitches.
- Ensure Mobile Responsiveness: Use responsive design so your site adapts to different screen sizes.
- Strengthen Calls to Action (CTAs): Make your CTAs clear, prominent, and compelling. Tell visitors exactly what you want them to do next.
- Use Internal Linking: Link to other relevant pages on your site to encourage exploration (this also helps reduce Bounce Rate in the UA sense).
- Improve Targeting: Refine your marketing efforts to attract an audience that is genuinely interested in your content and offerings.
Common Misconceptions and Caveats:
- High Bounce Rate != Bad: As mentioned, context is key. A utility page (like a store locator) might have a high bounce rate because the user found the information and left. Judge Bounce Rate in the context of the page’s goal and the user’s likely intent.
- Low Bounce Rate != Necessarily Good: A low bounce rate could indicate users are clicking around aimlessly, unable to find what they need, or are stuck in confusing loops.
- Bounce Rate vs. Exit Rate: Exit Rate is the percentage of sessions that were the last session on a specific page. A high Exit Rate on a conversion thank-you page is good; a high Exit Rate on a critical product page might be bad. Bounce Rate is only for entry pages where the user also left without further interaction.
In summary, Bounce Rate is a vital initial filter. It tells you how effectively your website captures initial attention and relevance. By segmenting and analyzing Bounce Rate, you can diagnose problems with specific landing pages, traffic sources, or user experiences.
Metric 2: Average Session Duration – The Depth of Engagement
What is Average Session Duration?
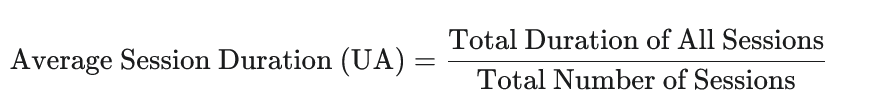
Average Session Duration is the average amount of time users spend on your website during a single session.
In Universal Analytics, Session Duration is calculated as the time difference between the first hit (like a page view) and the last hit of a session. A crucial limitation is that if a user lands on a page and leaves without triggering any other hits (a bounce), the session duration is recorded as 0 seconds.
This is why a high bounce rate negatively impacts your reported Average Session Duration, even if users spent a minute reading before leaving (in UA, that’s still a 0-second session).
(Where bounced sessions have 0 duration).
Note on GA4: GA4 calculates session duration more robustly. An “engaged session” (which contributes to average engagement time) is one lasting over 10 seconds, or having a conversion, or having 2+ page views. Average Engagement Time in GA4 is the average duration of engaged sessions.
GA4’s Average Session Duration is similar to UA but benefits from the more accurate engaged session calculation not being dragged down by quick bounces that actually spent some time on the page.
Average Engagement Time is often a more meaningful metric in GA4 than Average Session Duration as it filters out unproductive, very short sessions. Again, we focus on the concept of time spent and interaction depth, which both metrics aim to capture.
Why is Average Session Duration Crucial?
While Bounce Rate tells you if they stayed past the first page, Average Session Duration (and GA4’s Average Engagement Time) tells you how much time they spent actively engaging with your content and exploring your site.
Tracking Average Session Duration helps you understand:
- Content Performance: Are users spending time reading your articles, watching your videos, or exploring your product descriptions? Longer durations often indicate valuable and engaging content.
- Site Navigation Effectiveness: Can users easily find their way around your site and discover related content?
- User Interest Level: Visitors who spend more time on your site are generally more interested in what you offer.
- Impact of Site Structure and Design: An intuitive layout and appealing design can encourage users to stay longer and explore.
What Does a High or Low Average Session Duration Mean?
Generally, a higher Average Session Duration is better, indicating that visitors are finding value and spending more time consuming your content or interacting with your site.
- High Average Session Duration: Suggests your content is engaging, your navigation is effective, and users are finding what they are looking for or are being drawn deeper into your site.
- Low Average Session Duration: Can indicate that users are struggling to find relevant content, the content isn’t engaging, the site is difficult to navigate, or there are technical issues causing frustration.
However, like Bounce Rate, context is important. A very simple website with a single clear call to action might have a lower session duration but a high conversion rate – which might be exactly the desired outcome. The goal isn’t always to maximize time on site, but to maximize productive time on site that leads to desired actions.
Factors Influencing Average Session Duration:
Many factors influence how long a user stays on your site:
- Content Quality and Depth: Engaging, well-written, informative, or entertaining content keeps users hooked. Long-form content often leads to longer session durations if it’s valuable.
- Readability and Formatting: Easy-to-read text, clear headings, bullet points, and visuals make content more digestible.
- Internal Linking Strategy: Linking to related articles or products encourages users to explore further.
- Site Navigation and Structure: An intuitive menu and clear site hierarchy help users find other relevant pages.
- Presence of Rich Media: Videos, interactive elements, and podcasts can significantly increase time spent on a page.
- Page Load Speed: While crucial for Bounce Rate, speed also impacts session duration. A slow site is frustrating to navigate.
- Relevance to User Intent: If the user quickly finds their answer and leaves, session duration might be low but the visit successful (though GA’s calculation might record it as 0 in UA).
- Technical Performance: Broken features or errors will cause users to leave.
How to Track and Segment Average Session Duration:
- In Universal Analytics: Find Average Session Duration in Audience Overview, Acquisition Reports, and Behavior Reports. Look at it in conjunction with:
- Landing Pages Report: How long do users stay after landing on specific pages?
- All Pages Report: (Behavior > Site Content > All Pages) – See the average time spent on individual pages (Avg. Time on Page), which contributes to session duration.
- Channels/Source/Medium Reports: How does session duration vary depending on how users arrived?
- Devices Report: Are users spending more or less time on mobile vs. desktop?
- In Google Analytics 4: Track Average Session Duration and, more importantly, Average Engagement Time. Find these in reports like ‘Acquisition overview’, ‘User acquisition’, and ‘Pages and screens’. Use explorations to segment by various dimensions like channel, device, or specific event occurrences.
How to Improve Average Session Duration:
Improving Average Session Duration involves making your site more engaging and easier to explore:
- Create High-Quality, In-Depth Content: Go beyond surface-level information. Provide value that keeps users reading or watching.
- Improve Readability and Formatting: Use shorter paragraphs, bullet points, bold text, and relevant images or videos.
- Develop a Strategic Internal Linking Structure: Guide users to related content that might interest them. Think about the user journey and link to logical next steps.
- Enhance Site Navigation: Ensure your menu is clear and your site structure is logical. Use breadcrumbs to help users orient themselves.
- Incorporate Rich Media: Embed relevant videos, audio clips, or interactive graphics.
- Optimize for Speed: A faster site is a more enjoyable site to browse.
- Segment and Analyze: Identify the pages or traffic sources with low session durations and investigate why they are underperforming. Is the content poor? Is the traffic irrelevant?
Average Session Duration, especially when viewed alongside Bounce Rate, provides crucial insights into how well your website is holding user attention and delivering value beyond the initial click.
Metric 3: Conversion Rate – The Measure of Success
What is Conversion Rate?
Conversion Rate is arguably the most important metric for many websites because it directly measures whether users are completing desired actions that contribute to your business goals. A conversion is the completion of an activity that is important to the success of your business.
This could be anything from making a purchase to filling out a lead form, signing up for a newsletter, downloading a PDF, or watching a key video.
Conversion Rate is calculated as the percentage of sessions or users that result in a conversion.
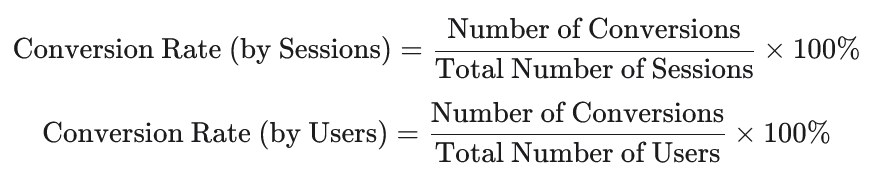
Note: Most standard reports in Google Analytics (both UA and GA4) default to calculating Conversion Rate by Sessions. Using Users can give you a different perspective, especially for goals where a single user might convert multiple times (like purchases).
Setting up Conversions (Goals in UA, Conversion Events in GA4) is the essential prerequisite for tracking this metric.
If you haven’t defined what a conversion is for your website in Google Analytics, Conversion Rate will be 0%, and you’ll be blind to your site’s ultimate effectiveness.
Why is Conversion Rate Crucial?
Conversion Rate is the closest thing Google Analytics has to a direct measure of your website’s return on investment (ROI) or effectiveness in achieving its primary objectives.
Traffic volume (Users/Sessions) is important, but a site with high traffic and a low conversion rate is like a shop with many window shoppers but few buyers. A site with moderate traffic but a high conversion rate is effectively turning visitors into valuable outcomes.
Tracking Conversion Rate helps you understand:
- Website Effectiveness: Is your site designed to guide users towards desired actions?
- User Journey Performance: Are there roadblocks or points of friction preventing users from converting?
- Marketing Channel Performance: Which traffic sources are bringing in visitors who are most likely to convert?
- Landing Page Effectiveness for Goals: Which entry pages are best at driving conversions?
- Impact of Changes: Did recent changes to your site design, copy, or layout positively or negatively affect your ability to convert visitors?
What Does a High or Low Conversion Rate Mean?
- High Conversion Rate: Indicates your website is effective at persuading visitors to take desired actions. Your user journey is likely smooth, your calls to action are clear, and your targeting is effective.
- Low Conversion Rate: Suggests there are significant barriers preventing users from converting. This could be due to poor design, confusing navigation, unclear value proposition, technical issues, slow load times, or targeting the wrong audience.
Conversion rates vary dramatically by industry, business model, device type, and the specific goal being tracked. Comparing yourself to generic “average” conversion rates isn’t always helpful. Instead, focus on:
- Tracking trends: Is your Conversion Rate improving over time?
- Segmenting your data: Analyze Conversion Rate by channel, source/medium, landing page, device, audience, and even specific campaigns. This tells you where your conversions are coming from and where the drop-offs are occurring.
- Micro vs. Macro Conversions: Track both macro conversions (your primary goals like sales or lead submissions) and micro conversions (smaller actions that indicate user engagement and progression towards a macro goal, like signing up for a newsletter or viewing a key page). Improving micro conversions can often lead to improvements in macro conversions.
Factors Influencing Conversion Rate:
Conversion Rate is influenced by a complex interplay of factors, often related to User Experience (UX) and persuasion:
- Website Design and Usability: An intuitive, easy-to-navigate, and aesthetically pleasing site builds trust and reduces friction.
- Clear Value Proposition: Do visitors immediately understand what you offer and why they should choose you?
- Compelling Copy and Calls to Action (CTAs): Is your messaging persuasive, and are your CTAs clear, prominent, and action-oriented?
- Trust and Credibility Signals: Testimonials, reviews, security badges, privacy policies, and clear contact information build trust.
- Page Load Speed: Slow pages frustrate users, especially during checkout or form submission processes.
- Mobile Optimization: A poor mobile experience is a huge conversion killer.
- Simplicity of Forms/Checkout: Too many fields or steps can lead to abandonment.
- Customer Support Availability: Easy access to help can alleviate concerns during the conversion process.
- Targeting and Traffic Quality: Bringing irrelevant visitors to your site will result in a low conversion rate, regardless of how good your site is.
- Pricing and Offers: Competitive pricing and compelling offers are significant conversion drivers.
How to Track and Segment Conversion Rate:
- The absolute first step is setting up Conversions in Google Analytics!
- In Universal Analytics: Go to Admin > Goals. Define goals based on Destination (thank you page URL), Duration (time on site), Pages/Screens per Session, or Event (form submission button click, video play).
- In Google Analytics 4: Go to Admin > Conversions. Mark existing events as conversions (e.g., ‘purchase’, ‘form_submit’, ‘sign_up’). You can also create new conversion events based on specific conditions.
- Analyze Conversion Rate in Reports:
- Acquisition Reports (Channels, Source/Medium): See which sources and channels bring in the most valuable, converting traffic.
- Landing Pages Report: Identify which entry pages are most effective at initiating converting sessions.
- Devices Report: Compare conversion rates across desktop, mobile, and tablet.
- Audience Reports: Analyze conversion rates for different demographic groups or user segments.
- Goal Flow (UA) / Path Exploration (GA4): Visualize the steps users take towards conversion and identify drop-off points.
- E-commerce Reports (if applicable): Detailed data on product performance, transaction revenue, average order value, etc.
How to Improve Conversion Rate (CRO – Conversion Rate Optimization):
Improving Conversion Rate is an ongoing process of testing and refinement known as Conversion Rate Optimization (CRO). Strategies include:
- Conduct A/B Testing: Test different headlines, calls to action, button colors, images, layouts, and pricing strategies.
- Simplify the User Journey: Reduce the number of steps needed to complete a goal.
- Optimize Forms: Reduce the number of fields, use clear labels, and provide inline validation.
- Enhance Trust Signals: Display security badges, customer testimonials, reviews, and clear contact information.
- Improve Page Speed, especially on conversion paths (product pages, cart, checkout).
- Ensure Mobile Optimization: Provide a seamless experience on all devices.
- Clarify Your Value Proposition: Make it immediately obvious what you offer and the benefits of converting.
- Use Heatmaps and Session Recordings: Tools like Hotjar or Crazy Egg (used in conjunction with GA) can show you where users click, scroll, and get frustrated.
- Gather User Feedback: Conduct surveys or user interviews to understand pain points.
- Refine Targeting: Ensure your marketing campaigns are reaching the audience most likely to be interested in your offer.
Conversion Rate is your ultimate performance scorecard. By focusing on improving this metric, you are directly working towards your business objectives.
Connecting the Dots: How the Three Metrics Work Together
While we’ve discussed Bounce Rate, Average Session Duration, and Conversion Rate individually, their true power lies in understanding how they relate to each other. They often represent a simplified view of the user journey:
- Bounce Rate: Did they stay long enough to get past the first page and engage at all? (Initial hurdle)
- Average Session Duration: If they stayed, how deeply did they engage with the content and explore the site? (Engagement depth)
- Conversion Rate: Did their engagement ultimately lead to a desired business outcome? (Goal achievement)
A low Bounce Rate combined with a high Average Session Duration and a high Conversion Rate is the ideal scenario – visitors arrive, find the site relevant and engaging, explore deeply, and complete desired actions.
Problems arise when these metrics are out of sync:
- High Bounce Rate, Low Duration, Low Conversion Rate: Your traffic isn’t relevant, or your initial landing page is failing to capture attention.
- Low Bounce Rate, Low Duration, Low Conversion Rate: Users are clicking around but not finding engaging content or clear paths to conversion. Your internal linking or content depth might be issues.
- Low Bounce Rate, High Duration, Low Conversion Rate: Users are engaged with your content but are not converting. There might be issues with your calls to action, the clarity of your offer, or friction in the conversion process.
- High Bounce Rate, High Duration, High Conversion Rate (less common, but possible): This could indicate users are landing on a page, spending a significant amount of time there (perhaps reading a long sales page), and then converting directly from that page. The “bounce” definition in UA is key here – if they convert via an event without another page view, it’s a bounce. GA4’s definition of an engaged session handles this better.
By looking at these three metrics together, segmented by various dimensions, you can start to diagnose where the biggest opportunities or problems lie in your user journey.
Beyond the Three: Using Other Metrics Strategically
While these three metrics form a powerful core, Google Analytics offers many other valuable data points.
The key is to use them to support your analysis of the core three and to drill down into specific areas once a problem or opportunity has been identified.
For example:
- If Conversion Rate from a specific traffic source is low, you might look at Source/Medium data to understand the origin and compare it to others.
- If Average Session Duration is low on a specific page, you might look at Pages per Session to see if users are visiting other pages or simply leaving. You might also look at Event Tracking to see if they are interacting with specific elements on the page (like videos or buttons).
- If Bounce Rate is high on a landing page, you might look at Device Category or Browser reports to see if the issue is specific to certain technologies.
Think of the three core metrics as your high-level health check. When you find something concerning or promising, you use other GA reports and metrics as diagnostic tools to understand why it’s happening.
Final Thoughts: Focus Leads to Action
In the sprawling landscape of Google Analytics, information overload is a constant threat. By choosing to focus on the three most fundamental and impactful metrics – Bounce Rate,
Average Session Duration, and Conversion Rate – you cut through the noise and gain a clear understanding of how users are interacting with your website and whether it’s meeting its business objectives.
Bounce Rate tells you about the effectiveness of your initial engagement and traffic quality. Average Session Duration reveals how well you are retaining attention and providing valuable content. Conversion Rate measures your ultimate success in turning visitors into valuable outcomes.
These three metrics, especially when analyzed in conjunction with each other and segmented appropriately, provide the essential insights needed to:
- Identify underperforming areas of your website.
- Understand which marketing efforts are driving the most valuable traffic.
- Prioritize website improvements based on potential impact on business goals.
- Measure the success of your optimization efforts.
Don’t let the sheer volume of data in Google Analytics paralyze you. Set up your conversion tracking, familiarize yourself with these three core metrics, and commit to monitoring them regularly.
Use them as your compass to guide your analysis and direct your efforts towards creating a website that not only attracts visitors but also engages them deeply and converts them into loyal customers or valuable leads.
By focusing on these fundamental indicators, you transform data into actionable insights and pave the way for sustainable online growth.